
Summary
Introduction
It can be useful to see how much effort is required for an Epic based on it’s children but while the functionality to see a sum total is available to some extent for Stories and Tasks, this is not the case for Epics.
This post shows you how to track scope for an Epic and its children and show that data in dashboard. Definitely useful for reporting!
Create fields for
Remaining Work - text field
Total Time Spent - text field
Delta - text field
Color Status - dropdown selector with options for
- 🟢 _On Track
- 🟡 _At Risk / Delayed
- 🔴 _Red
Automation
Trigger & Conditions
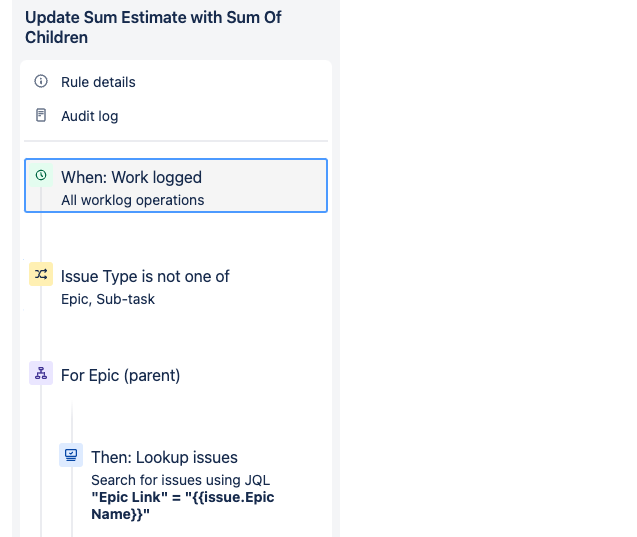
Step1: Define your automation trigger
We can use any desired trigger but for the purpose of limiting how often I want this automation to occur, I’ve set it to trigger whenever work is logged.
Step 2: Exclude Issue Types
Set the issue fields conditon so that the Field = “Issue Type” and the Condition = “is not one of” Value = “Epic” , “Sub-task”.
- We don’t want this automation to trigger for the Epic value because we want to calculate the Epic’s children.
- We don’t want this automation to trigger for the Sub-task value because we want to calculate the Epic’s children’s aggregate totals which includes the sub-tasks.
Step 3: Branch Rule & Lookup
Add a branch rule Type of related issues = “Epic (parent)” and restrict it to your project to avoid spending global automation runs.
Then, add the “Lookup Issues” action to the branch rule. The JQL should be "Epic Link" = {{issue.Epic Name}}
What we are doing here is defining that we want the following actions to take place within Epics that are parents of the issues that have triggered the automation flow. The lookup provides us with a variable to reference that points to the associated Epic.
Calculate Totals
This is where our newly created fields come in. We add another action in the branch rule “Edit Issue Fields” and modify the following fields:
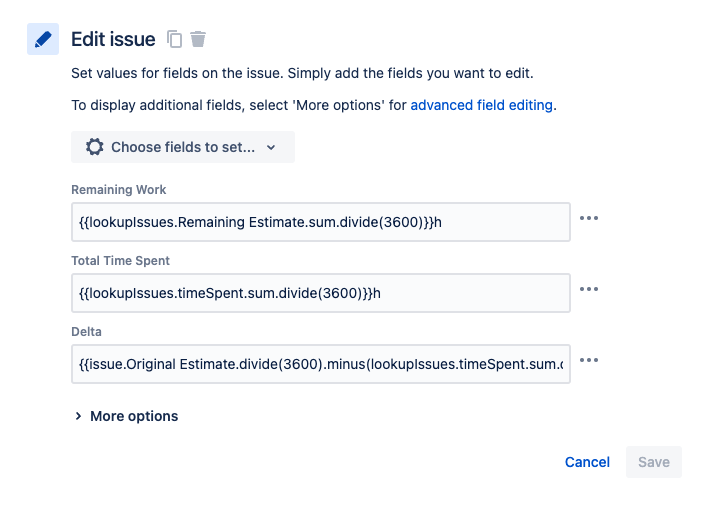
Calculates Sum Of Children’s Original Estimates
Remaining Work = {{lookupIssues.Remaining Estimate.sum.divide(3600)}}h
Calculates Sum Of Children’s Time Spent
Total Time Spent = {{lookupIssues.timeSpent.sum.divide(3600)}}h
Calculates Sum Of Children’s Remaining Estimates (Delta)
Delta = {{issue.Original Estimate.divide(3600).minus(lookupIssues.timeSpent.sum.divide(3600)).minus(lookupIssues.Remaining Estimate.sum.divide(3600))}} hours
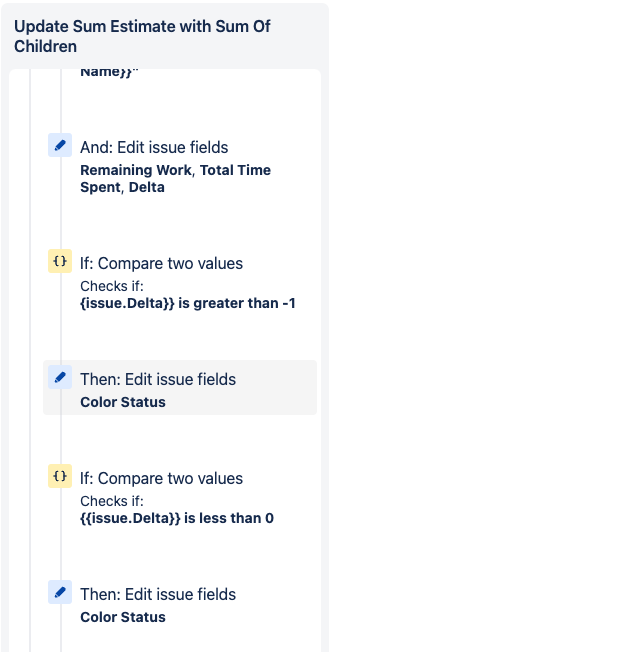
Color Status
This is the cherry on top 🍒! The following actions will determine the color status set for the Epic.
- Add an “Advanced Compare Condition” to the branch. The
First value={{issue.Delta}}. TheCondition= “greater than”. TheSecond value= “-1” - Add an “Edit Issue” action: Field to set is
Color Status= 🟢 _On Track - Add another “Advanced Compare Condition”. The
First value={{issue.Delta}}. TheCondition= “less than”. TheSecond value= “0” - Add another “Edit Issue” action: Field to set is
Color Status= 🔴 _Red
❗️ Make sure you publish your new rule! Try it out by adjusting adding a time entry to a User Story / Task.
Dashboard
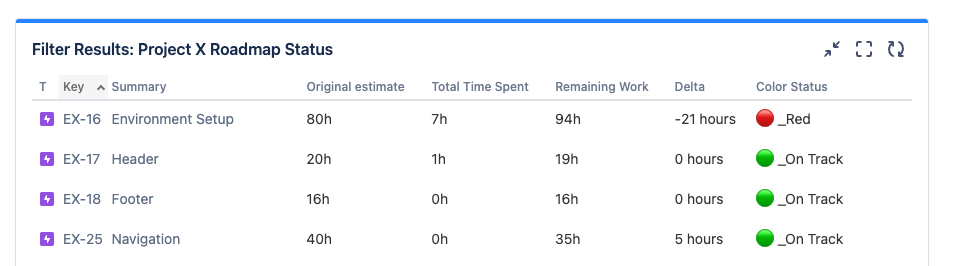
It’s great to see this data at an Epic level but it’s not super easy to show in reporting. This is where a Jira Dashboard can come in to display this data cleanly.

- Create a filter that shows the Epics that you want to show.
- In your Jira dashboard, Add a Filter Results widget and set the Saved Filter option to your newly created filter. The columns to display are:
a. Issue Type
b. Key
c. Summary
d. Orginal Estimate
e. Total Time Spent
f. Remaining Work
g. Delta
h. Color Status
Be Sure to hit Save!
 Never miss a story from us, subscribe to our newsletter